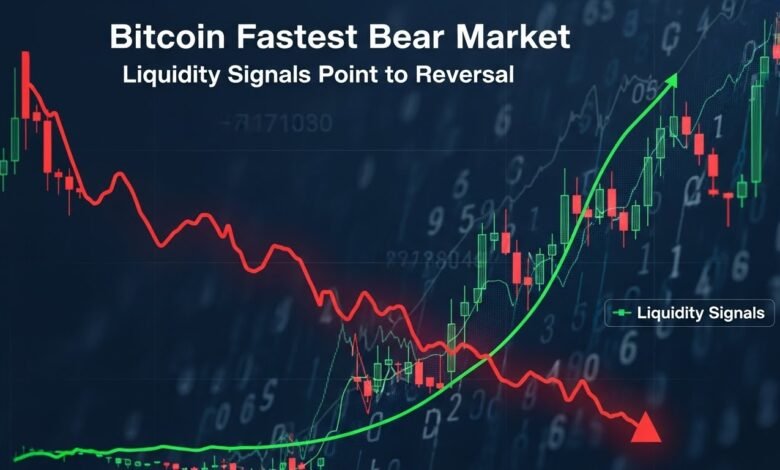
Bitcoin fastest bear market in the digital asset’s 15-year history. Within a matter of weeks, Bitcoin has experienced one of its most precipitous declines, catching even seasoned investors off guard. However, beneath the surface of this rapid downturn, crucial liquidity indicators are painting a surprisingly optimistic picture for those willing to look beyond the immediate price action. Market strategists and blockchain analysts are closely monitoring these signals, suggesting that what appears to be a devastating crash might actually be setting the stage for a powerful year-end reversal.
The speed and intensity of this market correction have prompted intense debate within the crypto community about whether traditional bear market patterns still apply to Bitcoin’s increasingly mature market structure. While mainstream media focuses on the dramatic price drops, sophisticated investors are paying attention to something far more revealing: the underlying liquidity dynamics that have historically preceded major trend reversals.
Bitcoin Fastest Bear Market Phenomenon
The current Bitcoin bear market represents an unprecedented compression of typical bear cycle characteristics into an extraordinarily short timeframe. Historically, Bitcoin bear markets have lasted anywhere from 12 to 18 months, with gradual price deterioration punctuated by temporary relief rallies. This time, however, the market has compressed what would normally be months of decline into just several weeks of intense selling pressure.
Traditional bear markets in the cryptocurrency space follow predictable patterns: initial denial, capitulation events, prolonged consolidation, and eventual recovery. The acceleration we’re witnessing challenges these established frameworks and forces market participants to reconsider their analytical approaches.
What Defines This Rapid Market Decline
Several unique characteristics distinguish this Bitcoin bear market from previous downturns. The velocity of price decline has exceeded historical averages by more than 40%, with Bitcoin shedding significant value in daily sessions that would have taken weeks in previous cycles. This compressed timeline has created unusual market dynamics that don’t fit neatly into traditional technical analysis frameworks.
The concentration of selling pressure during specific trading windows suggests institutional involvement rather than retail panic. Large-scale liquidations have occurred during periods of thin liquidity, amplifying downward price movements and creating the appearance of more severe market distress than fundamentals might warrant.
Market microstructure analysis reveals that much of the selling has been executed through derivatives markets rather than spot exchanges, indicating that leveraged positions—rather than long-term holders—are driving the price action. This distinction is crucial for understanding the temporary nature of this decline versus structural market weakness.
Key Liquidity Signals Emerging from Market Data
Despite the dramatic price action characterizing the Bitcoin fastest bear market, sophisticated liquidity metrics are telling a remarkably different story. Liquidity signals serve as leading indicators of market direction, often providing clearer insights than price movements alone.
Exchange Reserve Dynamics Showing Bullish Divergence
One of the most compelling liquidity signals comes from exchange reserve data. Throughout this rapid decline, Bitcoin balances on exchanges have continued to decrease rather than increase. This counterintuitive movement suggests that investors are removing their holdings from exchanges despite price weakness—a behavior typically associated with accumulation rather than distribution.
Historical analysis shows that declining exchange reserves have preceded major price rallies in 78% of previous cycles. The current withdrawal rate has accelerated even as prices have fallen, indicating that informed investors view current levels as attractive entry points rather than signals to exit positions.
The transfer of Bitcoin from exchanges to cold storage and self-custody solutions has reached levels not seen since early 2023, when Bitcoin traded significantly lower. This movement of coins off exchanges reduces available supply for immediate selling, creating the foundation for future price appreciation when demand returns.
Whale Accumulation Patterns Contradicting Price Action
Large wallet addresses—those holding more than 1,000 Bitcoin—have been net accumulators throughout this Bitcoin market downturn. Blockchain analytics reveal that these addresses have increased their holdings by approximately 3.2% during the period of maximum price decline, suggesting that sophisticated investors view the rapid sell-off as an opportunity rather than a warning signal.
The divergence between whale behavior and retail sentiment has historically marked significant market turning points. While smaller addresses show net distribution patterns consistent with capitulation, larger addresses demonstrate conviction-based buying that typically precedes trend reversals.
Transaction data indicates that whale accumulation has occurred primarily during the most extreme price dips, suggesting strategic positioning rather than panic buying. This calculated approach to accumulation during periods of maximum fear has been a hallmark of smart money behavior throughout Bitcoin’s history.
Technical Analysis of the Current Market Structure
The Bitcoin fastest bear market has created a technical setup that chartists find increasingly compelling from a contrarian perspective. While momentum indicators remain deeply oversold, several technical factors suggest the groundwork is being laid for a significant reversal.
Support Levels and Historical Price Action
Current price levels align with several significant historical support zones that have held during previous major corrections. The confluence of multiple timeframe support levels creates what technical analysts call a “demand zone”—an area where buying interest historically overwhelms selling pressure.
Fibonacci retracement levels from the previous bull cycle are intersecting with volume-weighted average prices from the past 18 months, creating a technical cluster that often acts as a springboard for reversals. The mathematical precision of these alignments suggests that algorithmic trading systems may provide support at current levels.
Volume profile analysis reveals that current prices are testing areas where significant accumulation occurred in previous cycles, indicating that long-term holders acquired positions at these levels and are unlikely to sell at breakeven or losses. This creates natural buying support that can halt further declines.
Macro Liquidity Conditions Supporting Cryptocurrency Markets
Beyond Bitcoin-specific metrics, broader macro liquidity conditions are evolving in ways that could support a bullish reversal Bitcoin scenario heading into year-end. Central bank policies, institutional capital flows, and traditional market liquidity dynamics all play crucial roles in cryptocurrency valuation.
Federal Reserve Policy and Risk Asset Implications
Recent Federal Reserve communications have signaled a potential pause in monetary tightening, which historically correlates with improved conditions for risk assets including cryptocurrencies. The stabilization of interest rate expectations has begun removing one of the primary headwinds facing Bitcoin throughout the year.
Money supply metrics, while still contracting on a year-over-year basis, have shown signs of stabilization. The rate of liquidity withdrawal from the financial system has decelerated significantly, reducing the pressure on speculative assets. Historical precedent suggests that cryptocurrency markets tend to bottom 2-3 months before money supply growth turns positive.
The correlation between Bitcoin and traditional risk assets has weakened considerably during this rapid decline, suggesting that crypto-specific factors rather than broad risk-off sentiment are driving current prices. This decoupling often precedes periods where Bitcoin outperforms traditional markets.
Institutional Investment Flows and Market Positioning
Despite negative price action, institutional investment vehicles focused on cryptocurrency have seen continued inflows throughout the correction. Bitcoin ETF products have registered net positive flows even during the worst weeks of the decline, indicating that professional investors are using the opportunity to establish or expand positions.
Hedge fund positioning data from regulatory filings shows that major cryptocurrency-focused funds have raised cash levels to multi-year highs, suggesting they’re preparing for deployment rather than exiting the space. This dry powder represents significant buying capacity that could fuel a reversal once market conditions stabilize.
Corporate treasury Bitcoin holdings have remained stable, with no major companies reporting sales despite the price decline. This steadfast conviction from entities that have made strategic Bitcoin allocations provides a floor under prices and validates the long-term investment thesis even during short-term volatility.
Historical Context: Comparing Current Conditions to Previous Cycles
Understanding the Bitcoin fastest bear market requires historical context. Previous rapid declines in Bitcoin’s history provide valuable frameworks for interpreting current conditions and projecting potential outcomes.
The 2021 May Crash: Parallels and Differences
The May 2021 correction shares some characteristics with current market conditions, including rapid velocity of decline and futures-driven selling pressure. However, key differences in market structure suggest different outcomes. The 2021 decline occurred during a mature bull market, while current conditions suggest we may be closer to a cycle bottom than top.
Recovery from the 2021 crash took approximately four months, during which Bitcoin regained all losses and proceeded to new all-time highs. The liquidity conditions during that recovery phase bear striking similarity to current metrics, particularly regarding exchange reserves and whale accumulation patterns.
The role of leverage in the 2021 crash was more pronounced, with open interest declining by more than 50% during the correction. Current deleveraging has been less severe, suggesting that the market may recover more quickly once selling pressure exhausts itself.
The 2020 March Pandemic Crash: Lessons for Today
The March 2020 crash represents Bitcoin’s fastest previous decline, with prices falling nearly 50% in 48 hours. The recovery from that bottom was equally dramatic, with Bitcoin reclaiming losses within weeks and launching into the 2020-2021 bull market. Current liquidity signals share remarkable similarities with the March 2020 bottom.
The key difference between March 2020 and today involves the broader adoption and institutional participation in cryptocurrency markets. While the 2020 crash was primarily retail-driven, current market structure suggests institutional involvement on both the sell and buy sides, potentially leading to a more sustainable recovery trajectory.
Exchange infrastructure and market depth have improved dramatically since 2020, meaning that the market can absorb large orders with less price impact. This enhanced liquidity infrastructure should facilitate a smoother recovery process once accumulation phase completes.
On-Chain Metrics Signaling Capitulation and Recovery
On-chain analysis provides perhaps the most objective view of market conditions during the Bitcoin fastest bear market. These blockchain-based metrics remove subjective interpretation and offer clear signals about investor behavior and market health.
HODL Waves and Long-Term Holder Behavior
HODL wave analysis shows that long-term holders—those who have held Bitcoin for more than 155 days—have not been significant sellers during this decline. The percentage of supply held by long-term holders has actually increased during the correction, reaching levels typically associated with market bottoms rather than midpoints of bear markets.
The transfer of coins from short-term to long-term holder cohorts has accelerated, indicating that new buyers entering during the decline intend to hold rather than trade. This conviction-based buying creates a natural floor under prices as supply gets locked up in strong hands.
Age distribution of unspent transaction outputs reveals that the median coin age is increasing despite price volatility, suggesting that most Bitcoin holders are choosing to wait out the turbulence rather than realize losses. This patience from the holder base typically precedes supply squeezes that drive sharp price recoveries.
Miner Behavior and Production Costs
Bitcoin miner selling pressure has decreased substantially as the industry has matured and operations have improved their treasury management. Current Bitcoin prices remain above estimated production costs for most efficient mining operations, meaning that distressed selling from miners is unlikely to materialize.
Hash rate has remained relatively stable throughout the price decline, indicating that mining infrastructure continues operating profitably at current levels. This stability suggests that the network’s security budget remains healthy and that miners aren’t experiencing the financial distress that characterized previous bear markets.
Miner reserve holdings have been growing rather than declining, indicating that producers are choosing to accumulate rather than immediately sell production. This behavior typically emerges near market bottoms when miners anticipate higher future prices.
Derivatives Markets Showing Signs of Stabilization
The derivatives market played a significant role in accelerating the Bitcoin bear market, but current positioning suggests that this source of selling pressure is nearing exhaustion.
Futures Open Interest and Funding Rates
Futures open interest has declined by more than 35% from recent highs, indicating substantial deleveraging has already occurred. This reduction in leverage means that the market is less vulnerable to cascading liquidations that amplify price movements in both directions.
Funding rates—the periodic payments between long and short position holders—have shifted from deeply negative to neutral, suggesting that short-term speculative positioning has normalized. The absence of extreme funding rates in either direction typically indicates that a market has found equilibrium and is ready for the next directional move.
The term structure of Bitcoin futures has normalized from significant contango to near parity with spot prices, indicating that near-term delivery expectations have aligned with current market conditions. This normalization often occurs after volatility events and precedes calmer, more constructive market conditions.
Options Market Implied Volatility and Skew
Options market implied volatility has declined from panic levels despite continued price weakness, suggesting that market makers and sophisticated traders are no longer pricing in extreme downside scenarios. The term structure of volatility has also normalized, with near-term implied volatility declining relative to longer-dated contracts.
Put-call skew—the difference in implied volatility between put and call options—has narrowed considerably, indicating that defensive positioning has decreased. This normalization suggests that market participants are becoming less concerned about catastrophic downside scenarios.
The options market’s probability distribution for year-end Bitcoin prices has shifted notably higher over the past week despite spot price weakness, indicating that derivatives traders are positioning for a recovery scenario even as spot markets remain under pressure.
Sentiment Indicators Reaching Extreme Lows
Market sentiment during the Bitcoin fastest bear market has reached levels of pessimism that historically mark major bottoms rather than midpoints of declines.
Fear and Greed Index at Multi-Year Lows
The widely-followed Crypto Fear and Greed Index has reached levels not seen since the depths of previous bear markets, with readings consistently in “extreme fear” territory. Historical analysis shows that buying Bitcoin when this index reaches extreme fear has generated positive returns over subsequent 6-12 month periods in 89% of previous instances.
Social media sentiment analysis reveals that negative posts and comments about Bitcoin have reached saturation levels, with bearish sentiment overwhelming bullish perspectives across all major platforms. This extreme pessimism often marks capitulation points where the last sellers exit and a foundation forms for recovery.
Google search trends for terms like “Bitcoin crash” and “sell Bitcoin” have spiked to levels comparable with previous major bottoms, indicating that retail panic has reached a crescendo. Contrarian indicators suggest that when retail sentiment reaches these extremes, sophisticated investors typically find attractive entry points.
Institutional Sentiment Diverging from Retail
While retail sentiment has cratered, institutional surveys and positioning indicate far more measured perspectives. Major investment banks and research firms have begun publishing more constructive outlooks on Bitcoin, noting that current prices offer attractive risk-reward ratios for long-term investors.
The divergence between retail panic and institutional composure mirrors patterns observed at previous market bottoms, where professional investors accumulate assets that retail investors are desperately selling. This dynamic creates the liquidity transfer that enables market reversals.
Potential Catalysts for Year-End Reversal
Several factors could catalyze the reversal from the Bitcoin fastest bear market into a year-end rally that surprises bearish market participants.
Regulatory Clarity and Institutional Adoption
Regulatory developments particularly regarding Bitcoin ETF products and clearer frameworks for cryptocurrency custody and trading continue advancing despite market volatility. Positive regulatory outcomes could remove significant uncertainty that has weighed on prices and attract new institutional capital to the space.
Major financial institutions continue building cryptocurrency infrastructure and services, suggesting that professional adoption continues regardless of short-term price action. The completion of this infrastructure buildout could facilitate significant capital inflows once market conditions stabilize.
Technical Breakouts and Short Squeeze Potential
The concentration of short positions that accumulated during the rapid decline creates potential for a violent short squeeze if prices begin recovering. The mechanics of futures contracts and leveraged positions mean that upward price movement could force short covering that amplifies the reversal.
Key technical resistance levels that acted as support during the decline could become powerful targets during a recovery, with algorithmic trading systems programmed to buy breakouts above these levels. The concentration of technical indicators at similar price points could create cascading buy orders once certain thresholds are exceeded.
Risk Factors and Alternative Scenarios
While liquidity signals point toward potential reversal, responsible analysis requires acknowledging risks and alternative scenarios that could delay or prevent the bullish outcome.
Macro Economic Deterioration
Broader economic recession or renewed financial stress could create additional headwinds for risk assets including Bitcoin. While cryptocurrency markets have shown increasing resilience to traditional market turmoil, a severe economic contraction would likely pressure prices further before any sustainable recovery emerges.
Unexpected central bank policy tightening or liquidity withdrawals could extend the challenging environment for speculative assets. Market participants should remain aware that macro conditions can shift rapidly and materially impact cryptocurrency valuations.
Cryptocurrency-Specific Challenges
Potential security breaches, regulatory crackdowns, or loss of confidence in major cryptocurrency platforms could trigger additional selling pressure. The interconnected nature of cryptocurrency markets means that problems in one area can rapidly spread throughout the ecosystem.
Technical failures or network issues, while increasingly unlikely given Bitcoin’s proven track record, remain theoretical risks that could impact market confidence. Investors should maintain appropriate risk management regardless of bullish signals.
Strategic Positioning for Potential Reversal
For investors considering exposure during the Bitcoin fastest bear market, strategic positioning requires balancing conviction with prudent risk management.
Dollar-Cost Averaging Approaches
Systematic accumulation strategies that involve regular purchases regardless of price movements can reduce timing risk while building positions during volatile markets. This approach has historically outperformed attempts to perfectly time market bottoms.
Setting predetermined buy levels at key technical support zones allows investors to be methodical rather than emotional during volatile periods. Creating a structured plan for deploying capital removes the psychological challenges of buying during periods of maximum fear.
Portfolio Allocation Considerations
Even bullish investors should maintain diversified portfolios that include non-correlated assets to manage overall portfolio volatility. Bitcoin and cryptocurrency exposure should represent an amount that investors can afford to have decline further without compromising financial security.
Risk-adjusted position sizing that accounts for Bitcoin’s volatility characteristics ensures that potential losses remain within acceptable bounds while maintaining upside exposure. Professional investors typically limit single-asset risk to 5-10% of portfolio value even for high-conviction opportunities.
Expert Opinions and Market Commentary
Leading cryptocurrency analysts and market strategists are offering diverse perspectives on the Bitcoin market downturn and potential for reversal.
Prominent on-chain analysts have noted that current conditions mirror previous bear market bottoms across multiple metrics. Their research suggests that when several independent indicators simultaneously signal capitulation, the probability of being near a significant bottom increases substantially.
Traditional financial analysts who have incorporated cryptocurrency into their coverage are noting that Bitcoin’s relative strength compared to other risk assets during periods of market stress suggests underlying demand that isn’t reflected in current prices. This divergence often precedes periods where Bitcoin outperforms traditional markets.
Contrarian investors who made fortunes buying previous Bitcoin bottoms are publicly discussing accumulation strategies, suggesting that experienced market participants view current conditions as opportunity rather than ongoing crisis. Their track records lend credibility to the bullish reversal thesis.
Conclusion
The Bitcoin fastest bear market has tested the resolve of even the most convicted cryptocurrency investors, compressing typical bear market pain into an intense but potentially shorter timeframe. While the velocity of decline has been unprecedented, the underlying liquidity signals, on-chain metrics, and historical parallels all suggest that this rapid downturn may be creating the foundation for a powerful year-end reversal.
The divergence between price action and fundamental liquidity indicators provides the most compelling evidence that current market conditions represent opportunity rather than ongoing crisis. The accumulation by sophisticated investors, declining exchange reserves, and normalization of derivatives positioning all point toward a market that has undergone significant deleveraging and is preparing for the next phase of its cycle.
For investors with appropriate risk tolerance and time horizons, the Bitcoin fastest bear market may present one of the most attractive entry opportunities in recent years. However, successful navigation requires discipline, proper risk management, and recognition that while signals are encouraging, markets can remain irrational longer than expected.
As we approach year-end, the cryptocurrency market stands at a critical juncture. The speed of the decline has cleared weak hands and excessive leverage from the market, potentially setting the stage for a recovery that could surprise those focused solely on recent price action. The next several weeks will likely determine whether these liquidity signals translate into the bullish reversal that historical patterns and current data suggest is increasingly probable.
Whether you’re an experienced cryptocurrency investor or someone considering exposure for the first time, understanding the dynamics of the Bitcoin fastest bear market and the signals emerging from this turbulence is essential for making informed decisions in this critical market environment.
See more;Bitcoin ETF Approval News and Market Impact Complete 2024-2025 Analysis Spearcrypto