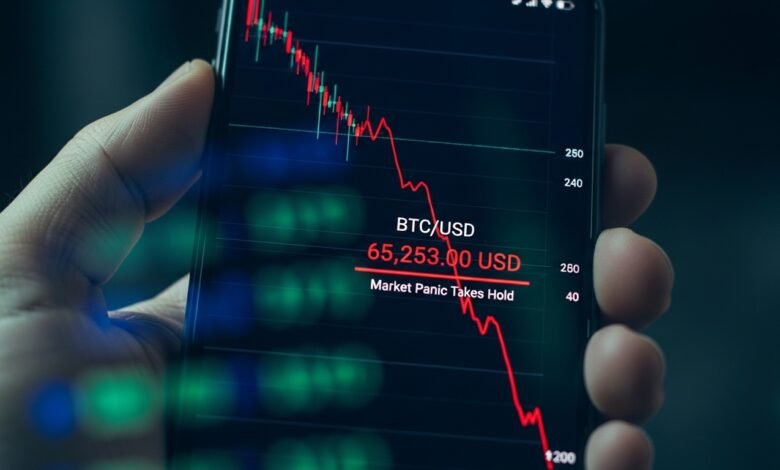
Bitcoin tests $65,253 market panic spreading across trading platforms and investor communities worldwide. As digital asset prices plummet and fear grips the market, one question dominates every conversation: is this the bottom, or is there more pain ahead? The flagship cryptocurrency has surrendered significant gains from its recent highs, leaving both institutional and retail investors scrambling to reassess their positions and strategies in an increasingly volatile landscape.
This dramatic price action represents more than just another correction in the notoriously volatile crypto markets. The current situation reflects a confluence of macroeconomic pressures, regulatory uncertainties, and technical breakdowns that have created a perfect storm for digital assets. Understanding what’s happening right now and what it means for the future of Bitcoin and the broader cryptocurrency ecosystem has never been more critical for anyone with exposure to these markets.
Current Bitcoin Market Situation
The cryptocurrency landscape has shifted dramatically as Bitcoin tests $65,253 amid what many analysts are calling one of the most significant market panics since the 2022 bear market. This price level represents a crucial psychological and technical threshold that could determine the trajectory of digital assets for months to come. The selling pressure has been relentless, with billions of dollars in market capitalization evaporating in a matter of days.
What makes this particular moment so significant is the speed and intensity of the decline. Unlike gradual corrections that allow markets to find equilibrium, this market panic has been characterized by rapid capitulation and forced liquidations across leveraged positions. The fear is palpable, with sentiment indicators showing extreme pessimism levels that historically have preceded either major bottoms or further declines into true bear market territory.
The $65,253 level has emerged as a critical battleground between bulls and bears. This price point aligns with several important technical indicators, including previous support zones, moving averages, and Fibonacci retracement levels that traders watch closely. Whether Bitcoin can hold above this threshold or breaks down further will likely set the tone for the entire cryptocurrency market in the coming weeks and potentially months.
What Triggered This Wave of Market Panic?
Multiple factors have converged to create the current environment where Bitcoin tests $65,253 market panic conditions. Understanding these catalysts is essential for anyone trying to navigate these treacherous waters and make informed decisions about their cryptocurrency holdings or potential investments.
Macroeconomic Headwinds Intensify
The global economic environment has become increasingly challenging for risk assets, including Bitcoin and other cryptocurrencies. Central banks worldwide continue to grapple with persistent inflation concerns, leading to monetary policy decisions that have drained liquidity from financial markets. When traditional markets face pressure, cryptocurrencies often experience amplified volatility as investors flee to perceived safety.
Interest rate expectations have shifted dramatically, with market participants now pricing in a prolonged period of tighter monetary conditions. This fundamental shift in the financial landscape has removed one of the key pillars that supported the previous Bitcoin bull market. The relationship between liquidity conditions and cryptocurrency prices has become impossible to ignore, and the current environment offers little in the way of supportive tailwinds for digital assets.
Furthermore, geopolitical tensions and economic uncertainty have created an atmosphere of risk aversion that extends well beyond cryptocurrency markets. Traditional safe haven assets have attracted capital that might otherwise have flowed into alternative investments like Bitcoin. This dynamic has contributed significantly to the selling pressure that has pushed prices down to the $65,253 level where the market now finds itself.
Technical Breakdown and Cascade Effects
From a technical analysis perspective, the move that has Bitcoin tests $65,253 levels represents a breakdown of multiple support structures that had held firm during previous corrections. When key technical levels fail, they often trigger automated selling from algorithmic trading systems and stop-loss orders, creating a cascade effect that accelerates price declines beyond what fundamental factors alone might justify.
The market panic intensified as Bitcoin broke below its 200-day moving average, a widely watched indicator that many traders consider the dividing line between bull and bear markets. This technical failure shook confidence among holders who had been expecting prices to stabilize at higher levels. The subsequent selling pressure created a self-reinforcing cycle where falling prices triggered more selling, which in turn pushed prices even lower.
Leveraged positions across cryptocurrency derivatives markets have played a significant role in amplifying the volatility. As Bitcoin declined, margin calls forced traders to either add collateral or have their positions automatically liquidated. These forced liquidations added tremendous selling pressure at precisely the moments when the market was most vulnerable, contributing to the sharp moves that characterize the current market panic environment.
Is This the Bottom? Analyzing Key Indicators
Determining whether the current level where Bitcoin tests $65,253 represents a genuine bottom or merely a temporary pause in a longer decline requires examining multiple indicators and perspectives. Market bottoms are notoriously difficult to identify in real-time, but certain signals can provide valuable insights into the probability of further downside versus the potential for a meaningful reversal.
On-Chain Metrics and Investor Behavior
On-chain analysis provides unique visibility into Bitcoin holder behavior that traditional markets cannot replicate. Currently, several interesting patterns have emerged that could signal either capitulation or continued weakness. Long-term holders have generally maintained their positions, showing conviction despite the price decline. This resilience among experienced investors historically has been associated with market bottoms, though it is not a guarantee of imminent recovery.
Exchange inflows and outflows tell another part of the story. During periods of genuine market panic, investors often move Bitcoin to exchanges in preparation for selling. Recent data shows elevated exchange inflows, suggesting that distribution has not yet run its course. However, the rate of these flows appears to be decelerating, which could indicate that selling pressure is beginning to exhaust itself as the market approaches potential bottom territory.
The supply held by short-term holders, those who acquired Bitcoin within the past few months, has declined significantly. This pattern suggests that weak hands are being shaken out of the market, a process that must typically run its course before sustainable recovery can begin. The question remains whether enough capitulation has occurred at the $65,253 level or whether additional pain awaits before a true bottom forms.
Sentiment and Fear Indicators
Market sentiment has reached levels of extreme fear that historically have corresponded with attractive entry points for long-term investors. The Fear and Greed Index for Bitcoin has plunged into territory associated with major bottoms in previous cycles. While these extreme readings do not guarantee that prices cannot fall further, they do suggest that pessimism has reached levels where contrarian opportunities often emerge.
Social media sentiment analysis reveals widespread despair and capitulation among retail investors, with many declaring the end of the Bitcoin bull market and questioning the long-term viability of cryptocurrencies. This extreme negativity, while painful for current holders, actually represents a potential contrary indicator. Markets often bottom when the last optimists finally give up hope, and current sentiment readings suggest we may be approaching that inflection point.
Professional analyst predictions have become increasingly bearish, with many prominent voices calling for significantly lower prices in the weeks and months ahead. This consensus bearishness could itself become a contrarian signal if it becomes too extreme. Markets have a tendency to inflict maximum pain on the maximum number of participants, and the current setup where Bitcoin tests $65,253 market panic conditions could potentially catch bears off guard if a reversal materializes.
Historical Context: Comparing Past Market Panics
Understanding how the current situation where Bitcoin tests $65,253 compares to previous market panic episodes provides valuable perspective for investors trying to navigate these challenging conditions. The cryptocurrency market has experienced multiple severe corrections throughout its history, each offering lessons about market dynamics and recovery patterns.
The 2022 Bear Market Comparison
The 2022 bear market saw Bitcoin decline from approximately $69,000 to lows near $15,500, a drawdown of more than 75 percent. That devastating correction was driven by a combination of aggressive Federal Reserve tightening, the collapse of major cryptocurrency platforms and companies, and a general reset of valuations across all risk assets. The current decline, while significant, has not yet approached the magnitude of that previous bear market.
However, the speed and character of the current market panic share some similarities with the initial stages of that 2022 decline. The breakdown of key technical levels, the surge in volatility, and the shift in narrative from bullish optimism to bearish fear all echo patterns from that earlier period. The critical question is whether this represents the beginning of a similarly severe bear market or merely a sharp correction within an ongoing bull market structure.
One key difference between now and 2022 lies in the fundamental backdrop for Bitcoin and cryptocurrencies. The current market has the benefit of clearer regulatory frameworks in many jurisdictions, growing institutional adoption, and improving infrastructure. These fundamental supports were largely absent during the depths of 2022, potentially providing a floor for prices that did not exist during that earlier crisis.
Recovery Patterns from Previous Bottoms
Analyzing how Bitcoin has recovered from previous bottoms reveals patterns that could inform expectations for the current situation. Historical data shows that genuine market bottoms are typically followed by extended consolidation periods before meaningful recoveries begin. Prices often retest bottom levels multiple times before finally establishing a sustainable uptrend, a pattern that could play out again if $65,253 represents a true bottom.
The recovery trajectory from major bottoms has varied significantly across different cycles. Some bottoms have been followed by rapid V-shaped recoveries, while others have led to prolonged base-building periods lasting many months. The character of the recovery often depends on the fundamental drivers behind both the decline and the subsequent reversal. Understanding which scenario is most likely requires careful analysis of current market conditions and catalysts.
Volume patterns during recovery phases provide important confirmation signals for investors. Genuine bottoms are typically characterized by declining volume as sellers exhaust themselves, followed by increasing volume as buyers step in. The current volume profile as Bitcoin tests $65,253 market panic levels shows elevated activity consistent with capitulation, but sustained buying volume has not yet emerged to confirm a definitive bottom.
Strategic Considerations for Investors
Navigating the environment where Bitcoin tests $65,253 amid widespread market panic requires careful strategic thinking and emotional discipline. The decisions investors make during these critical moments often have outsized impacts on long-term portfolio performance. Understanding the options available and their respective risk-reward profiles is essential for making informed choices.
Dollar-Cost Averaging and Accumulation Strategies
For investors with long-term conviction in Bitcoin and cryptocurrency, market panics often present opportunities to accumulate positions at favorable prices. Dollar-cost averaging, the practice of investing fixed amounts at regular intervals regardless of price, can be particularly effective during volatile periods. This approach removes the psychological burden of trying to time exact market bottoms while ensuring participation in any eventual recovery.
The current price level where Bitcoin finds itself represents a significant discount from recent highs, potentially offering an attractive entry point for patient capital. However, investors must be prepared for the possibility of further declines and ensure they maintain sufficient liquidity to continue accumulating if prices move lower. Setting predefined price targets for additional purchases can help maintain discipline during emotional market conditions.
Risk management remains paramount regardless of accumulation strategy. Even investors with strong long-term conviction should carefully consider position sizing and ensure that Bitcoin exposure does not represent an inappropriately large portion of their overall portfolio. The volatility demonstrated during this market panic serves as a stark reminder that cryptocurrency investments can experience dramatic price swings in both directions.
Portfolio Rebalancing and Risk Assessment
The sharp decline that has brought Bitcoin tests $65,253 levels may have significantly altered the risk profile of portfolios that include cryptocurrency exposure. For investors who maintain target allocation percentages, this correction could represent an opportunity to rebalance by adding to Bitcoin positions that have declined as a percentage of total portfolio value.
Conversely, some investors may determine that the increased uncertainty and volatility warrant a reduction in cryptocurrency exposure. This decision requires honest assessment of risk tolerance, investment timeline, and financial circumstances. The emotional stress of watching portfolio values decline can provide valuable information about whether current cryptocurrency allocations are appropriate for an individual’s true risk capacity.
Diversification across different cryptocurrencies and blockchain platforms can help mitigate some of the concentration risk associated with holding only Bitcoin. While the flagship cryptocurrency often leads market movements, different digital assets can perform differently during various market conditions. Building a thoughtful portfolio that aligns with investment objectives and risk tolerance should be a priority during periods of market panic and reflection.
Technical Analysis: Key Levels to Watch
As Bitcoin tests $65,253, technical analysis provides a framework for understanding potential support and resistance levels that could define future price action. While technical indicators are not infallible predictors of market direction, they offer valuable insights into where significant buying or selling pressure might emerge as prices fluctuate.
Critical Support and Resistance Zones
The $65,253 level itself has emerged as an important support zone, with multiple technical indicators converging around this price point. Below this level, additional support could be found at round number psychological levels and previous consolidation zones from earlier in the market cycle. Identifying these potential support areas helps investors prepare for various scenarios and set risk parameters accordingly.
Above current prices, resistance levels represent obstacles that Bitcoin must overcome to confirm that the market panic has subsided and a recovery is underway. Previous support levels that have been broken often become resistance on any rallies, creating a series of hurdles that must be cleared for bullish sentiment to return. Understanding this dynamic helps set realistic expectations for potential recovery trajectories.
The relationship between price and volume at key technical levels provides important confirmation signals. High volume at support levels can indicate strong buying interest, while low volume could suggest that the support is vulnerable to further breakdown. Monitoring these dynamics as Bitcoin navigates the current price environment offers real-time feedback about the balance between buyers and sellers.
Moving Averages and Momentum Indicators
Moving averages provide smoothed trend indicators that help filter out short-term noise and identify the underlying direction of Bitcoin price movements. The 200-day moving average, in particular, has historically served as an important dividing line between bull and bear markets. The current price action relative to this and other moving averages offers clues about the broader market structure.
Momentum indicators like the Relative Strength Index can help identify oversold conditions that might precede bounces or reversals. During the current market panic, many of these indicators have reached extreme readings suggesting that Bitcoin is technically oversold. However, markets can remain oversold for extended periods during genuine bear markets, so these signals must be interpreted within the broader context.
Convergence and divergence patterns between price and momentum indicators can provide early warning signals about potential trend changes. Bullish divergences, where price makes new lows but momentum indicators fail to confirm, often precede reversals. Watching for these patterns as Bitcoin tests $65,253 could offer advance notice if market dynamics are beginning to shift from panic to stabilization.
What This Means for the Broader Crypto Market
The situation where Bitcoin tests $65,253 market panic conditions has significant implications that extend well beyond the flagship cryptocurrency itself. As the dominant digital asset by market capitalization and the bellwether for the entire cryptocurrency ecosystem, movements in Bitcoin prices typically drive correlated action across thousands of alternative cryptocurrencies and digital tokens.
Altcoin Impact and Correlation Dynamics
Alternative cryptocurrencies, commonly known as altcoins, typically experience amplified volatility relative to Bitcoin during periods of market stress. The current market panic has been no exception, with many altcoins declining by significantly larger percentages than Bitcoin itself. This pattern reflects both the higher risk profiles of smaller cryptocurrencies and the tendency for investors to flee to relative safety during uncertain periods.
The correlation between Bitcoin and altcoins tends to increase during market panics as broad-based selling overwhelms the fundamental differences between individual projects. While some high-quality alternative cryptocurrencies may offer better long-term value propositions than Bitcoin, they often cannot escape the gravitational pull of Bitcoin price action during periods of widespread fear and liquidation.
Recovery patterns across the cryptocurrency market often follow a predictable sequence, with Bitcoin typically stabilizing first before altcoins begin their own recoveries. Understanding this dynamic can help investors make more informed decisions about which assets to hold or accumulate as the market navigates through current turbulence toward eventual stabilization.
Institutional Investment and Market Maturity
The presence of institutional investors in the Bitcoin market has grown dramatically in recent years, fundamentally changing market dynamics compared to previous cycles. The current situation where Bitcoin tests $65,253 provides a real-time test of whether institutional participation provides stability or adds to volatility during stressed market conditions.
Evidence suggests that institutional investors have generally maintained their positions despite the current market panic, in contrast to retail investors who often capitulate during sharp declines. This institutional resilience could provide a floor for prices that was absent in earlier market cycles. However, institutional investors also face their own constraints and pressures that could lead to selling if conditions deteriorate further.
The maturation of cryptocurrency markets through improved infrastructure, clearer regulations, and broader participation should theoretically lead to reduced volatility over time. Yet the current market panic demonstrates that the market remains capable of violent price swings that would be extraordinary in traditional asset classes. This ongoing volatility reflects both the relatively small size of cryptocurrency markets and the leverage and speculation that still dominate trading activity.
Expert Perspectives and Market Analysis
Professional analysts and industry experts have offered diverse perspectives on whether the level where Bitcoin tests $65,253 represents a bottom or merely a pause in a longer decline. Understanding these various viewpoints can help investors develop more nuanced perspectives on current market conditions and potential future trajectories.
Bull Case Arguments
Optimistic analysts point to several factors that could support the thesis that Bitcoin is approaching or has already found a bottom at current levels. The combination of extreme fear sentiment, technically oversold conditions, and strong fundamentals around adoption and infrastructure development creates what bulls see as an attractive risk-reward setup for long-term investors.
Furthermore, the halving event that occurred in 2024 continues to impact Bitcoin supply dynamics in ways that should theoretically support prices over time. Historical patterns suggest that the period twelve to eighteen months after a halving has typically been characterized by strong price appreciation, and some analysts believe the current weakness represents a final shakeout before that historical pattern reasserts itself.
The macroeconomic environment, while currently challenging, could shift in ways that benefit Bitcoin and cryptocurrencies. Any signs of central bank policy pivots toward easier monetary conditions or acceleration of inflation could drive capital toward alternative stores of value like Bitcoin, potentially triggering a recovery from current depressed levels.
Bear Case Concerns
Skeptical analysts warn that the current market panic could be just the beginning of a more severe bear market. They point to deteriorating macroeconomic conditions, potential regulatory crackdowns, and technical damage that could take many months to repair. From this perspective, the $65,253 level where Bitcoin currently trades could be merely a temporary stopping point on the way to significantly lower prices.
Concerns about leverage in the cryptocurrency ecosystem continue to worry bearish analysts who see parallels to previous cycles where excess speculation preceded devastating crashes. If leveraged positions remain elevated, further forced liquidations could drive prices substantially lower even in the absence of new fundamental negative catalysts.
Additionally, some bears question whether Bitcoin and cryptocurrencies have truly established themselves as legitimate asset classes or remain primarily speculative vehicles subject to boom-bust cycles. If broader adoption fails to materialize as bulls anticipate, the fundamental case for sustained higher prices becomes more questionable, potentially justifying much lower valuations than current levels.
Preparing for Multiple Scenarios
Given the uncertainty surrounding whether the point where Bitcoin tests $65,253 represents a bottom or merely a pause, prudent investors should prepare for multiple potential scenarios. Developing contingency plans for different market outcomes can help maintain composure and execute rational strategies regardless of how events unfold.
If This Is the Bottom
Should current levels prove to be the bottom of this correction, investors who maintain or add to positions stand to benefit from any subsequent recovery. The key in this scenario is having sufficient conviction and capital to hold through any remaining volatility as a base forms and eventually gives way to a new uptrend. Historical precedent suggests that early participants in recoveries from major bottoms often achieve the best risk-adjusted returns.
Investors should establish clear criteria for confirming that a bottom has indeed formed rather than assuming current levels represent the ultimate low. These criteria might include price action breaking above key resistance levels, momentum indicators showing sustained improvement, or on-chain metrics indicating accumulation by sophisticated investors. Waiting for confirmation reduces the risk of catching a falling knife but may mean missing the absolute bottom prices.
Recovery from major market bottoms rarely follows a straight line, and investors should be prepared for significant volatility even if the worst of the decline has passed. Setting realistic expectations about the timeline and character of potential recovery can help maintain appropriate perspective and avoid disappointment if the path forward proves choppy and uncertain.
If Further Decline Awaits
Alternatively, if the current level where Bitcoin tests $65,253 market panic conditions represents merely a pause before further decline, different strategies become appropriate. Investors with existing positions must decide whether to maintain current exposure, reduce risk, or even add to positions at lower prices. This decision depends heavily on individual risk tolerance, investment timeline, and financial circumstances.
Establishing predetermined price levels for additional purchases can help maintain discipline if prices decline further. Rather than attempting to catch the exact bottom, investors might plan to dollar-cost average at multiple predetermined levels, ensuring participation in any eventual recovery while managing the risk of mistiming market bottoms.
Protecting capital becomes paramount if bear market conditions persist. For some investors, this may mean reducing cryptocurrency exposure to levels that allow for peaceful sleep and maintain financial stability. There is no shame in acknowledging that current market conditions exceed personal risk tolerance and adjusting positions accordingly.
Conclusion
The situation where Bitcoin tests $65,253 market panic levels represents a critical juncture for the cryptocurrency market and all participants within it. Whether this marks the bottom of the current correction or merely a waystation on a longer journey lower remains uncertain. What is clear, however, is that the decisions investors make during this period of heightened volatility and fear will likely have significant impacts on their long-term outcomes.
Success in navigating market panic conditions requires combining analytical rigor with emotional discipline. Understanding the technical, fundamental, and sentiment factors that influence Bitcoin prices provides a framework for making informed decisions. However, maintaining composure when portfolio values fluctuate dramatically and adhering to predetermined strategies regardless of short-term price action often proves even more important than analytical sophistication.
For long-term believers in the cryptocurrency revolution, periods of market panic can represent opportunities to accumulate positions at discounted prices. For others, these volatile conditions serve as reminders about the risks inherent in speculative assets and the importance of maintaining appropriate position sizing. There is no single correct answer for all investors, only the imperative to make conscious, deliberate choices aligned with individual circumstances and objectives.
As Bitcoin continues to test critical support levels and the market grapples with fear and uncertainty, staying informed about market developments while maintaining perspective on long-term goals offers the best path forward. Whether you choose to accumulate, hold, or reduce cryptocurrency exposure during this turbulent period, ensure your strategy reflects careful thought rather than emotional reaction to short-term price movements.
See more;Bitcoin Hits $105K Despite Iran Tensions, Institutional Adoption Surges