
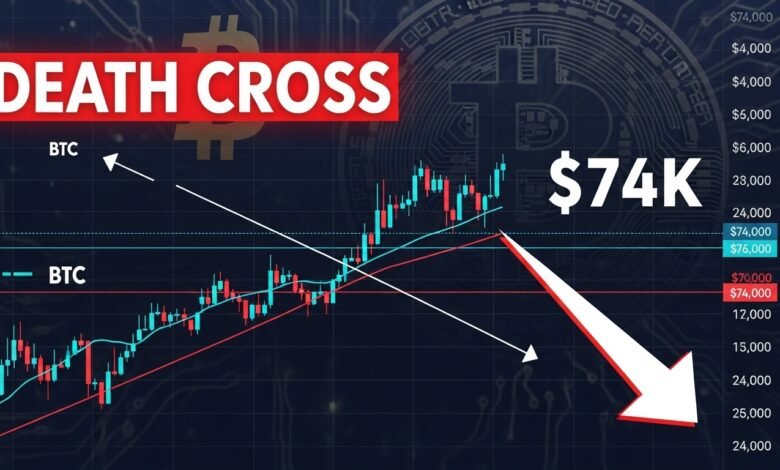
Bitcoin price prediction that could send shockwaves through the digital asset ecosystem. Recent technical indicators suggest that Bitcoin may be heading toward a substantial correction, with the ominous death cross pattern potentially triggering a 30% decline that would push BTC prices down to approximately $74,000. This Bitcoin price prediction comes at a time when investors are closely monitoring chart patterns, trading volumes, and macroeconomic factors that could influence the world’s largest cryptocurrency by market capitalization. Understanding these technical signals and market dynamics has become crucial for both institutional investors and retail traders navigating the increasingly complex cryptocurrency market analysis landscape.
Death Cross Pattern in Bitcoin Trading
The death cross represents one of the most feared technical indicators in traditional financial markets, and its implications for Bitcoin technical analysis cannot be overstated. This bearish signal occurs when a short-term moving average, typically the 50-day moving average, crosses below a long-term moving average, usually the 200-day moving average. The pattern suggests that recent price momentum has weakened significantly compared to longer-term trends, potentially signaling an extended period of downward pressure.
For Bitcoin specifically, the death cross pattern has historically preceded major corrections, though its predictive accuracy remains a subject of debate among technical analysts. The psychological impact of this formation often becomes self-fulfilling as traders react to the signal by reducing their positions or implementing defensive strategies. Market participants who closely follow BTC price forecast models understand that while the death cross does not guarantee a sustained bear market, it does indicate that bearish sentiment has gained considerable strength relative to bullish forces.
The formation of this pattern typically unfolds over weeks or even months, giving astute observers advance warning of potential trouble ahead. During this formation period, trading volumes often provide crucial confirmation signals. When the death cross materializes with above-average volume, it carries more weight than formations occurring during periods of low market participation. Current market conditions suggest that if Bitcoin does form a death cross in the coming weeks, it could mark a significant turning point for the cryptocurrency market analysis that investors have been conducting throughout this cycle.
Breaking Down the $74,000 Bitcoin Price Target
The specific Bitcoin price prediction of $74,000 is not an arbitrary figure but rather derives from multiple technical support levels, Fibonacci retracement sequences, and historical price behavior patterns. This price target represents approximately a 30% decline from recent highs, placing it within the range of typical corrections that Bitcoin experiences during broader bull market cycles. Understanding how analysts arrive at such precise predictions requires examining the confluence of technical factors that point toward this support zone.
From a Fibonacci perspective, the $74,000 level corresponds to a significant retracement from Bitcoin’s all-time highs, representing a key area where buyers have historically stepped in to defend the asset. This BTC price forecast also aligns with previous resistance levels that, once broken, typically transform into support zones according to classical technical analysis principles. The psychological significance of maintaining a price above $70,000 cannot be underestimated, as round numbers often serve as important battlegrounds between bulls and bears in the cryptocurrency markets.
Volume profile analysis further supports the validity of this price target, showing substantial trading activity occurred in the $74,000 to $76,000 range during Bitcoin’s previous ascent. These high-volume nodes indicate areas where many market participants established positions, suggesting that these same traders might defend these levels if prices decline. The cryptocurrency market analysis community widely recognizes that high-volume areas tend to act as magnets for price action during corrections, as they represent zones of equilibrium where buying and selling interests previously balanced.
Historical Context of Bitcoin Death Crosses
Examining previous occurrences of the death cross in Bitcoin’s trading history provides valuable context for the current Bitcoin price prediction. The cryptocurrency has experienced several death crosses throughout its existence, with varying outcomes that challenge simplistic interpretations of this technical indicator. During the 2018 bear market, Bitcoin formed a death cross that preceded an extended period of declining prices, ultimately resulting in an 80% drawdown from the previous cycle’s peak. However, other instances have proven less catastrophic, with Bitcoin recovering relatively quickly after brief corrections.
The 2019 death cross offers a particularly instructive case study for contemporary Bitcoin technical analysis. Following the formation of this bearish pattern, Bitcoin initially declined but then reversed course within months, ultimately rallying to new local highs as buying pressure overwhelmed the negative technical signal. This historical precedent reminds traders that while the death cross merits serious attention, it should not be viewed as an infallible predictor of sustained bear markets.
More recently, during the 2021-2022 cycle, Bitcoin formed a death cross that did indeed precede a significant correction, though the magnitude and duration of the decline varied depending on broader macroeconomic conditions. The key lesson from examining these historical patterns is that the death cross pattern functions best as one component of a comprehensive analytical framework rather than a standalone trading signal. Successful crypto market volatility navigation requires synthesizing technical indicators with fundamental analysis, sentiment readings, and awareness of external factors affecting digital asset valuations.
Factors That Could Accelerate Bitcoin’s Decline
Several converging forces could amplify the bearish implications of the death cross and drive Bitcoin toward the $74,000 BTC price forecast target more rapidly than anticipated. Macroeconomic headwinds continue to pose challenges for risk assets broadly, with central bank policies, inflation dynamics, and geopolitical tensions creating an uncertain backdrop for cryptocurrency investments. When traditional markets experience stress, Bitcoin often faces selling pressure as investors reduce exposure to speculative assets in favor of perceived safe havens.
Regulatory developments represent another critical variable that could influence this Bitcoin price prediction. Government actions regarding cryptocurrency taxation, trading restrictions, or institutional custody requirements have historically triggered significant price movements. Any unexpected regulatory announcements from major jurisdictions could catalyze rapid selling that pushes Bitcoin through technical support levels more quickly than chart patterns alone would suggest. The cryptocurrency market analysis community remains vigilant regarding policy developments from the United States, European Union, and Asian regulatory bodies.
Leverage liquidations present a particularly dangerous accelerant during declining markets. The cryptocurrency derivatives market has grown substantially, with billions of dollars in leveraged long positions potentially vulnerable to cascading liquidations if Bitcoin breaches key support levels. As prices decline, overleveraged positions face margin calls, forcing automated selling that drives prices lower still, potentially creating a self-reinforcing downward spiral. This crypto market volatility mechanism has produced some of Bitcoin’s most dramatic single-day declines during previous corrections.
Technical Support Levels to Watch
Beyond the $74,000 primary target outlined in this Bitcoin price prediction, several other technical support levels deserve attention from traders planning their risk management strategies. The $80,000 level represents the first major support zone that Bitcoin would encounter during a decline from current levels. This area corresponds to previous consolidation ranges and represents a psychologically significant threshold where initial buying interest might materialize.
If Bitcoin breaks below $80,000 with conviction, the next critical support zone emerges around $77,000, where multiple technical factors converge. This level represents a key Fibonacci retracement, aligns with a previous high-volume trading node, and corresponds to the lower boundary of a ascending trend channel that has contained Bitcoin’s price action during recent months. The Bitcoin technical analysis framework suggests that a breakdown below $77,000 would likely trigger accelerated selling toward the $74,000 target discussed in this analysis.
Beyond $74,000, traders should prepare for the possibility that Bitcoin support levels might not hold on the first test, potentially leading to further downside exploration. The $70,000 psychological level represents a major line in the sand, with a break below this round number potentially opening the door to declines toward $65,000 or even $60,000 in a worst-case scenario. Understanding these cascading support levels helps investors develop contingency plans and position sizing strategies appropriate to their risk tolerance and investment timeframes.
Contrarian Scenarios: What Could Invalidate the Bearish Prediction
While this BTC price forecast presents a compelling bearish case, responsible analysis requires acknowledging scenarios that could invalidate this prediction and potentially lead to continued upside instead. A decisive break above recent highs with strong volume would negate the death cross signal before it fully forms, suggesting that bullish momentum remains intact despite technical deterioration. Such a development would likely trigger short covering and fear-of-missing-out driven buying that could propel Bitcoin to new all-time highs.
Institutional adoption continues to evolve as a powerful fundamental driver that could override bearish technical signals. Major announcements regarding corporate Bitcoin treasuries, spot Bitcoin ETF inflows, or sovereign wealth fund allocations could generate buying pressure sufficient to absorb selling from technical traders. The cryptocurrency market analysis landscape has changed dramatically over recent years, with institutional participation introducing new dynamics that sometimes conflict with traditional technical analysis predictions.
Macroeconomic shifts could also render this bearish Bitcoin price prediction obsolete. If central banks pivot toward more accommodative monetary policies sooner than expected, risk assets including Bitcoin might rally despite unfavorable technical setups. Similarly, unexpected inflation developments, currency crises in major economies, or geopolitical events that enhance Bitcoin’s appeal as a non-sovereign store of value could trigger buying that overwhelms the selling pressure associated with the death cross pattern.
Trading Strategies for a Potential Bitcoin Decline
Investors concerned about the bearish implications of this Bitcoin technical analysis have several strategic options for protecting capital while maintaining exposure to potential upside. Dollar-cost averaging represents a time-tested approach that allows investors to accumulate Bitcoin gradually during price declines, reducing the risk of poorly timed single large purchases. This strategy proves particularly effective during extended corrections when precise bottom-picking becomes nearly impossible.
For more active traders, establishing predetermined buy zones aligned with the support levels discussed in this BTC price forecast can help remove emotion from decision-making during volatile market conditions. Setting limit orders at $80,000, $77,000, and $74,000 allows traders to methodically accumulate positions if these levels are reached, while avoiding the temptation to chase prices or panic sell during temporary drawdowns.
Options strategies offer sophisticated investors methods for hedging existing Bitcoin holdings or profiting from the anticipated decline while limiting downside risk. Purchasing put options provides defined-risk downside protection, while selling covered calls generates income that offsets some decline in the underlying asset. Understanding these derivatives instruments has become increasingly important for navigating crypto market volatility as the market has matured and institutional participation has grown.
Impact on Altcoins and Broader Crypto Markets
The ramifications of this Bitcoin price prediction extend far beyond BTC itself, with significant implications for the broader cryptocurrency ecosystem. Historically, major Bitcoin corrections trigger amplified selling in alternative cryptocurrencies, with many altcoins declining 40-60% or more when Bitcoin experiences a 30% correction. This correlation stems from Bitcoin’s role as the reserve currency of cryptocurrency markets and the tendency for risk appetite to contract across the entire digital asset sector during stress periods.
Ethereum, as the second-largest cryptocurrency by market capitalization, typically exhibits somewhat lower correlation to Bitcoin than smaller altcoins, though it rarely escapes unscathed during major BTC declines. The cryptocurrency market analysis for ETH suggests that a move to $74,000 in Bitcoin could push Ethereum toward critical support levels around $2,500 to $2,800, representing substantial downside from recent trading ranges. Investors holding diversified cryptocurrency portfolios should prepare for portfolio-wide drawdowns if this bearish scenario materializes.
Smaller cap altcoins face even greater vulnerability during Bitcoin corrections, as liquidity evaporates and risk-off sentiment dominates trading decisions. Projects with strong fundamentals, active development teams, and genuine utility may recover more quickly once the correction concludes, while speculative tokens with limited actual usage often experience permanent impairment. This differentiation process, though painful for holders of weak projects, ultimately strengthens the crypto market by directing capital toward assets with genuine long-term viability.
On-Chain Metrics and What They Reveal
Beyond traditional technical analysis, blockchain data provides unique insights into Bitcoin network dynamics that complement this Bitcoin price prediction. On-chain metrics tracking whale accumulation patterns, exchange inflows and outflows, and long-term holder behavior offer windows into the intentions of different market participant categories. Recent data shows mixed signals, with some whales accumulating during recent dips while others appear to be distributing positions ahead of anticipated volatility.
Exchange reserve metrics provide particularly valuable information regarding potential selling pressure. When Bitcoin balances on exchanges increase substantially, it typically indicates that holders are moving coins into venues where they can be sold, suggesting bearish positioning. Conversely, declining exchange reserves generally signal that investors are moving Bitcoin into cold storage for long-term holding. Current exchange flow data shows moderate increases in balances at major trading venues, lending some credence to the bearish BTC price forecast outlined in this analysis.
The MVRV ratio, which compares Bitcoin’s market capitalization to realized capitalization, offers insights into whether current prices represent historical overvaluation or undervaluation. Elevated MVRV readings have preceded major corrections in previous cycles, while compressed readings often emerge near cyclical bottoms. Present MVRV levels suggest Bitcoin trades in a neutral zone rather than obvious extremes, indicating that while the asset is not drastically overvalued, neither does it represent a screaming bargain that would likely prevent the correction outlined in this Bitcoin technical analysis.
Expert Opinions and Analyst Consensus
The cryptocurrency analyst community remains divided regarding the likelihood of this bearish Bitcoin price prediction materializing, with perspectives ranging from apocalyptic warnings of extended bear markets to dismissals of technical analysis in favor of bullish fundamental narratives. Prominent technical analysts who focus on chart patterns and indicators have increasingly highlighted the death cross risk, arguing that ignoring such clear warning signals has proven costly in previous cycles.
Conversely, analysts who emphasize fundamental factors point to improving institutional adoption metrics, expanding payment network integration, and macroeconomic conditions that favor scarce digital assets. These optimists acknowledge the technical deterioration but argue that Bitcoin’s long-term trajectory remains firmly upward regardless of short-term corrections. The cryptocurrency market analysis debate between technicians and fundamentalists has intensified as these two analytical schools reach increasingly divergent conclusions.
Quantitative analysts applying machine learning models and multi-factor frameworks to BTC price forecast generation occupy a middle ground, assigning probability distributions rather than making deterministic predictions. These models typically suggest elevated downside risk in the near term while maintaining positive expected returns over longer horizons. Understanding that even sophisticated analytical approaches generate probabilistic rather than certain outcomes helps investors maintain appropriate humility regarding the inherent unpredictability of cryptocurrency markets.
Risk Management Principles for Crypto Investors
Regardless of whether this specific Bitcoin price prediction proves accurate, the analysis underscores fundamental risk management principles that all cryptocurrency investors should embrace. Position sizing represents the most critical risk management tool, ensuring that no single investment outcome, regardless of magnitude, threatens overall financial wellbeing. Financial advisors typically recommend limiting cryptocurrency exposure to amounts investors can afford to lose completely, though individual risk tolerances vary substantially.
Stop-loss orders provide mechanical protection against catastrophic losses, automatically exiting positions when prices breach predetermined levels. While stop-losses sometimes result in selling near temporary bottoms, they prevent the devastating losses that occur when investors maintain positions through complete collapses. Setting stop-losses at levels that would invalidate one’s investment thesis rather than arbitrary percentages, helps balance protection against premature exit.
Portfolio diversification extends beyond simply holding multiple cryptocurrencies to encompass uncorrelated asset classes that perform differently under various market conditions. Maintaining allocations to traditional stocks, bonds, commodities, and cash ensures that a crypto market downturn does not devastate overall wealth. This balanced approach allows investors to weather Bitcoin corrections without being forced to liquidate positions at inopportune times due to external financial pressures.
Long-Term Perspective Amid Short-Term Volatility
While the near-term Bitcoin technical analysis presents legitimate concerns, maintaining perspective on Bitcoin’s long-term value proposition remains crucial for investors whose time horizons extend beyond immediate price movements. Bitcoin’s fundamental characteristics, including its fixed supply schedule, decentralized architecture, and growing network effect,s continue strengthening regardless of temporary price fluctuations. The asset has demonstrated remarkable resilience through multiple boom-bust cycles, consistently recovering from drawdowns that would have destroyed assets with weaker fundamental foundations.
Historical analysis reveals that Bitcoin corrections, however painful in the moment, have consistently provided attractive entry points for patient investors willing to endure short-term volatility. Every major correction in Bitcoin’s history, including the catastrophic 80% decline during the 2018 bear market, ultimately resolved in new all-time highs for investors who maintained conviction through difficult periods. This track record does not guarantee future performance but suggests that the current bearish BTC price forecast may represent an opportunity rather than a calamity for those with appropriate time horizons.
The maturation of cryptocurrency markets’ infrastructure, including regulated custody solutions, institutional-grade trading venues, and mainstream payment integration, provides fundamental support that did not exist during previous cycles. These developments suggest that while crypto market volatility will likely remain elevated compared to traditional assets, the magnitude and duration of future corrections may moderate as the market evolves. Bitcoin’s journey from fringe internet experiment to recognized asset class represents an ongoing process rather than a completed transition.
Preparing Your Portfolio for Multiple Outcomes
Prudent investors develop contingency plans for multiple scenarios rather than betting everything on a single Bitcoin price prediction. A scenario-planning framework recognizes that the death cross could trigger the anticipated decline to $74,000, but also acknowledges possibilities including sideways consolidation, failed breakdown attempts, or continued upside despite technical deterioration. Allocating capital across these scenarios rather than concentrating bets on one outcome provides flexibility to benefit regardless of which path materializes.
Tactical rebalancing strategies allow investors to maintain target cryptocurrency allocations while systematically selling strength and buying weakness. If Bitcoin rallies despite bearish technical signals, rebalancing captures profits and reduces exposure. Conversely, if prices decline toward $74,000 as predicted, rebalancing provides a disciplined framework for accumulating positions at lower prices. This mechanical approach removes emotion from decisions that typically prove most difficult during periods of extreme market sentiment.
Building cash reserves specifically earmarked for deployment during corrections positions investors to act decisively when opportunities emerge. Many investors experience frustration during Bitcoin declines because they lack available capital to capitalize on improved valuations, having fully deployed resources during previous price strength. Maintaining dry powder specifically for deployment during drawdowns transforms corrections from threats into opportunities, fundamentally changing one’s psychological relationship with crypto market volatility.
Conclusion
The Bitcoin price prediction, suggesting a potential decline to $74,000 driven bya death cross formation, presents a sobering outlook that demands serious consideration from cryptocurrency investors. Technical indicators clearly point toward elevated near-term downside risk, with the convergence of moving averages, weakening momentum, and potential support levels painting a bearish picture. However, Bitcoin’s history demonstrates that corrections, while uncomfortable, represent normal features of cryptocurrency market cycles rather than existential threats to the asset’s long-term viability.
Whether Bitcoin reaches the predicted $74,000 level or defies bearish expectations depends on countless variables including macroeconomic developments, institutional adoption trajectories, regulatory evolution, and the complex interplay of technical factors that drive short-term price discovery. What remains certain is that crypto market volatility will continue providing both risks and opportunities for market participants, regardless of near-term directional movements.
Investors should approach this Bitcoin technical analysis as valuable input for risk management and strategic planning rather than deterministic prophecy. By maintaining appropriate position sizes, developing contingency plans for multiple scenarios, and focusing on long-term fundamental value rather than short-term price fluctuations, cryptocurrency investors can navigate uncertain periods while positioning themselves for ultimate success in this revolutionary asset class.
See more: Bitcoin Price Prediction For 2025: Will It Shine Like Gold?