

Bitcoin price prediction chatter has hit a fresh fever pitch. This week, influencer Andrew Tate rattled traders by warning that BTC could plunge toward $26,000, just as the market performed a classic liquidity sweep that wicked through obvious stop zones before snapping back. While some see the flush as routine market mechanics, others fear it’s the first domino of a deeper cascade.
Understanding the difference matters, Bitcoin Price Prediction: because whether you’re swing-trading or building a long-term position, conviction must be grounded in structure, flows, and risk—never in headlines alone. Reports summarizing Tate’s call to $26K have circulated widely, contrasting sharply with more constructive takes from veteran crypto voices who framed the drop as a standard shakeout rather than the start of a capitulation spiral.
In this in-depth guide, we unpack the Bitcoin liquidity sweep that rattled sentiment, examine what a “deep crash” would require technically and structurally, and build a data-driven BTC forecast across multiple scenarios. You’ll find clear levels, catalysts to watch, a trader’s playbook, and a realistic view of risk so you can navigate volatility without chasing noise.
What Tate Said—and Why It Caught Fire
Multiple outlets highlighted Andrew Tate’s assertion that Bitcoin is “going to $26,000,” amplifying the forecast across X and crypto media. For many retail traders, that number—well below current cycle context—sparked worry about a repeat of past capitulation phases. This call arrived just as BTC’s sharp drop triggered panic liquidations, making the narrative especially resonant. Meanwhile, other well-known market participants argued that the pullback looked like a buyable liquidity sweep rather than the start of a prolonged downtrend. The juxtaposition of these takes—“deep crash” versus “buy the dip”—is what has traders split.
Liquidity Sweep 101: Why the Market Hunts Your Stops
If you’ve ever watched price rip through a prior swing high or low, trigger a cascade of stops, and then abruptly reverse, you’ve seen a liquidity sweep. In simple terms, large players seek pockets of resting orders—stop-losses, breakout buys, and liquidation pools—because filling substantial positions requires liquidity. Price spikes into those pools, executes the orders, and then often snaps back, leaving late chasers offside. That dynamic can look like manipulation, but in practice, it’s often the path of least resistance to fill size. Multiple trading resources describe sweeps as temporary excursions beyond obvious levels before mean-reverting; in crypto, where leverage is common, these moves can be especially violent.
Understanding sweeps matters because Bitcoin price predictions frequently misread a flush as trend death. A sweep that raids liquidity and returns inside the prior range is a different signal from a clean breakdown that accepts a new lower value. If you confuse the two, you can sell the low or short the last down candle just as the market reclaims.
Did We Just See a Textbook Sweep—or the Start of Something Worse?
The recent spike through obvious stop zones, followed by a sharp reaction, fits the anatomy of a sweep. That alone doesn’t guarantee bullish continuation, but it does challenge the idea that one violent candle equals a “deep crash.” For a true crash, you’d want to see persistent acceptance below the swept levels, failed retests that turn support into resistance, and expanding downside participation—spot volumes, derivative open interest rebuilding on the short side, and risk contagion across correlated assets. Reports covering Tate’s $26K warning hit precisely when liquidation flows were peaking, but other respected market voices framed the same drop as an opportunity, not an omen. This split underscores why traders need a framework beyond headlines.
Technical Structure The Levels That Matter If $26K Is on the Table
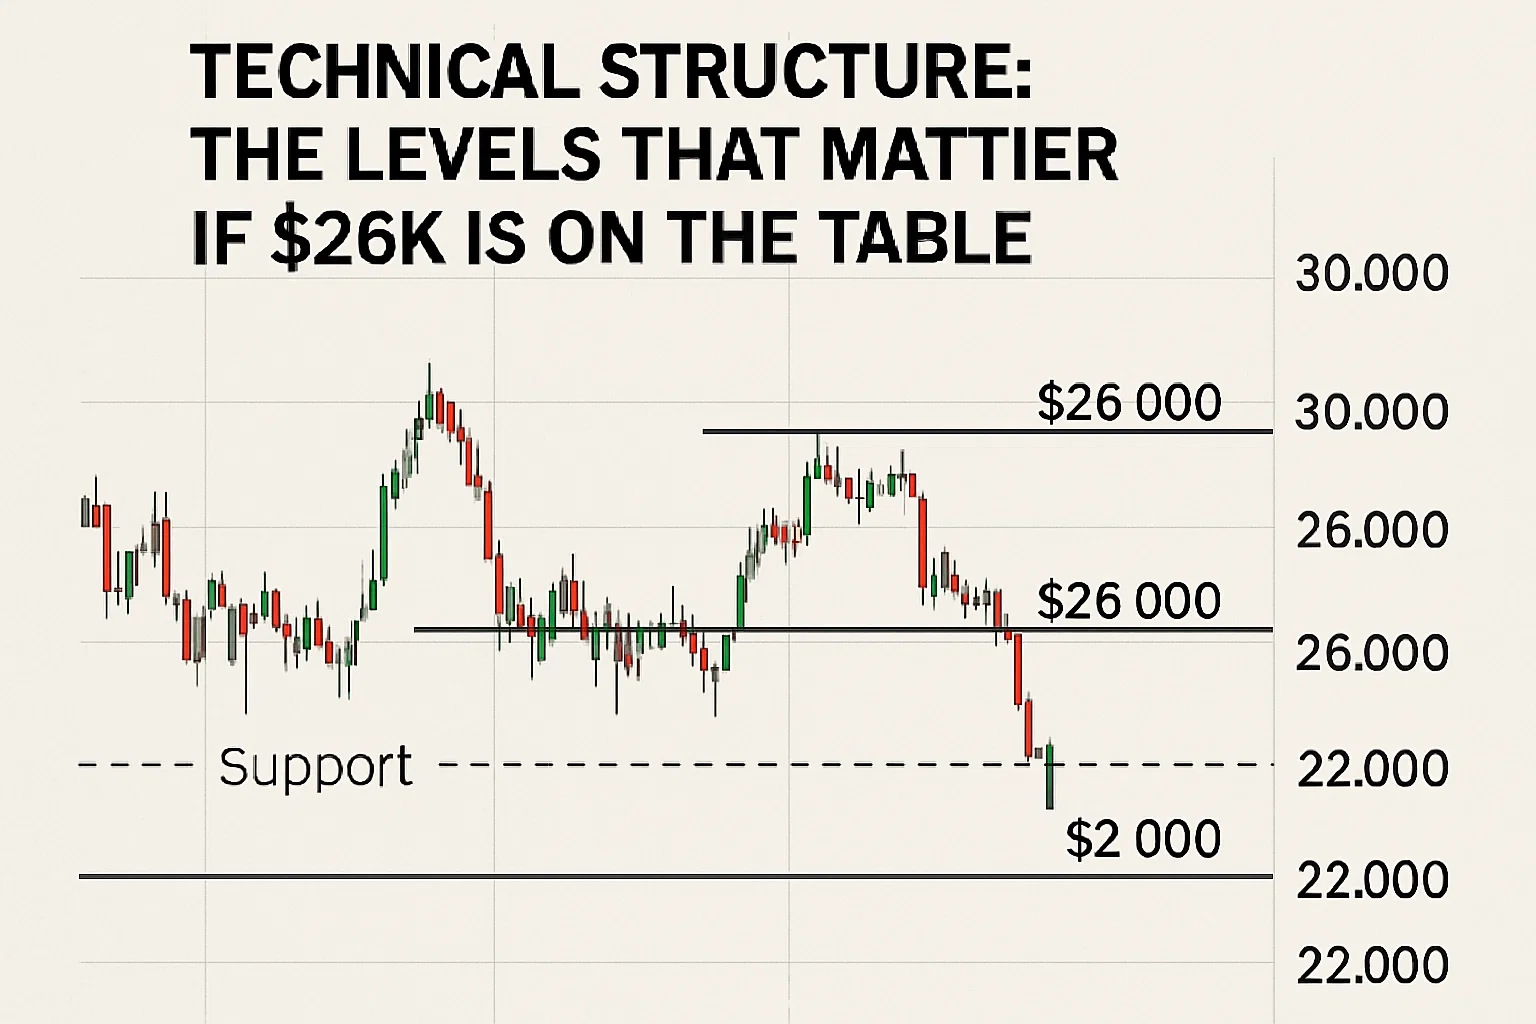
Range Context and High-Time-Frame Structure
On higher time frames, Bitcoin tends to oscillate within broad ranges punctuated by expansions. When a sweep occurs near range edges, the critical tell is whether the price accepts below that edge. If acceptance fails and BTC closes back inside the range with rising spot demand, the sweep often marks continuation. A deep crash narrative requires clean invalidations: weekly closes below key demand, failure to reclaim, and momentum divergence that persists rather than resets.
Mid-Cycle Floors and “Max Pain”
Historical cycles show mid-cycle drawdowns of 25%–40% are common even within persistent uptrends. A call to $26,000 implies far more than a standard pullback from local highs; it implies a structural break or a macro shock that forces de-risking across spot and derivatives simultaneously. In other words, $26K is not simply “another dip.” It would require confluence: breakdown of multi-month supports, accelerating ETF outflows, worsening macro liquidity, and possibly regulatory or credit stress that hits crypto-native balance sheets.
The Validation/Invalidation Map
For traders, clarity beats certainty. A practical Bitcoin price prediction map:
- Bullish validation: After a sweep, BTC reclaims lost levels on strong spot volume, derivative funding normalizes (or goes modestly negative and then flips), and the market establishes higher lows. That dynamic argues the sweep was a liquidity event, not a trend change.
- Bearish validation: BTC accepts below the swept lows on high volume, fails every reclaim attempt, and ETF flows turn decisively negative over multiple sessions. If these conditions persist, lower downside targets become valid probabilities, not scare headlines.
Flow Signals: ETF Behavior, Derivatives, and On-Chain Breadth
ETF Flows as Sentiment Thermometer
Since spot ETFs became a major conduit for institutional exposure, inflows and outflows have served as a high-signal sentiment gauge. Deep, sustained outflows tend to coincide with breakdowns; a quick flip back to inflows often tracks reclaims. Reports surrounding the recent drop noted caution from some institutional channels, but opinions were split on whether this was a structural warning or a routine shakeout. Watching multi-day net flow remains essential for the next legs.
Derivative Positioning and Funding
When funding rates are strongly positive and price grinds up, a bearish liquidity sweep through prior highs can set up a sharp reversal. Conversely, when funding plunges, open interest wipes out, and late shorts pile in after a drop, the stage is set for a short squeeze back into the range. Efficient BTC forecasting integrates these inputs rather than leaning on a single narrative.
On-Chain Breadth and Realized Profit/Loss
During genuine trend breakdowns, on-chain data typically shows broad capitulation: rising realized losses, dormancy breaking on older coins, and deterioration in short-term holder cost basis relative to spot price. In sweeps, you see stress, but it’s often localized and short-lived. Traders should track breadth, not just price candles, to distinguish a shakeout from a crash.
The Case for Caution: Why a Deeper Drawdown Can’t Be Ruled Out
Narrative Volatility and Influencer Impact
Whether you follow him or not, Andrew Tate commands attention, and his calls can influence retail behavior—especially in highly leveraged corners of the market. Past episodes around Tate’s trading and token ventures have drawn scrutiny and controversy, reinforcing a wider lesson: celebrity signals aren’t risk management. Publications have reported prior losses in his leveraged trading and warned about the hazards of blindly following high-profile personalities. That doesn’t make his $26K target impossible—it simply means you shouldn’t treat it as a standalone thesis.
Macro and Liquidity Backdrop
If real yields rise, the dollar strengthens, or risk appetite deteriorates, crypto can experience correlated drawdowns. Add regulatory shocks or exchange-specific stress, and the path to a “deep crash” opens. None of these are guaranteed; they’re scenario inputs. The key is to pre-commit to invalidation points so you can act, not react.
The Case Against a Deep Crash: Why the Sweep Might Be Constructive
Structural Demand and Buy-the-Dip Behavior
One reason some seasoned traders viewed the drop as an opportunity is the presence of structural demand—incremental adoption via regulated vehicles, long-only mandates, and continued institutional education. In prior cycles, there was less sticky demand. Today, even when outflows appear, flows can rotate back quickly once volatility cools. That’s why several observers labeled the move a shakeout, not a collapse.
Post-Sweep Reclaims and Mean Reversion
When BTC wicks through an obvious low, hoovers up stops, and then reclaims with conviction, the path of least resistance often reverts to the mean within the prior range. The litmus test is whether price accepts back inside and builds value above reclaimed levels. A successful reclaim undercuts the crash narrative because trapped shorts must cover, adding fuel to recovery.
Strategy Guide: How Traders Can Navigate the Next 2–6 Weeks
For Short-Term Traders
If you’re trading the liquidity sweep narrative, define a line in the sand. Use the swept level and the candle close that reclaimed it as your structural guide. As long as the price holds above that reclaim on a closing basis, the long bias is intact. Lose it, and the “deep crash” thesis gains credibility. Avoid over-optimization by chasing every micro swing; let the higher-time-frame structure do the heavy lifting.
For Swing Traders
Build tiered entries rather than single all-in orders. If BTC revisits the sweep area and holds, add. If it reclaims a major weekly level, add on confirmation with stops under structure. If you believe the $26K scenario is plausible, plan your risk as if it could happen: pre-size positions, set maximum drawdown limits, and respect invalidation without debate.
For Long-Term Allocators
Your edge is time. Volatility clusters, and on longer horizons, Bitcoin’s trend has paid those who accumulate during fear. But being long-term isn’t code for being reckless. Use dollar-cost averaging with periodic rebalancing, and consider a rules-based overlay that modestly de-risks into euphoria and adds into drawdowns. Long-term ROI is a function of discipline, not prediction.
Key Catalysts to Watch
ETF Net Flows and Liquidity Conditions
Consistent inflows stabilize price; sustained outflows weigh on structure. Track multi-session trends, not just a single day’s print. If outflows persist alongside failed reclaims, the $26K path gets less hypothetical. If flows flip positive while BTC holds reclaimed levels, the sweep likely marked a bear trap.
Derivatives Reset and Funding Baselines
A healthy reset looks like washed-out open interest, neutral to modestly negative funding, and gradually improving spot leads. An unhealthy reset looks like quickly rebuilding crowded longs into resistance or shorts into support—conditions that set up the next squeeze rather than a trend.
Macro Data and Dollar Dynamics
Stronger-than-expected growth, sticky inflation, or rising real yields can pressure risk assets broadly. Conversely, softening macro or easing financial conditions can buoy BTC even after unsettling sweeps. Map major data dates to your trading calendar so macro surprises don’t blindside your technical plan.
A Balanced Bitcoin Price Prediction (Near-Term)
Putting it together, here’s a balanced BTC forecast framework for the near term:
- Base case (range-bound recovery): The sweep shakes out leverage, BTC reclaims key levels, and ETF flows stabilize or improve modestly. Price chops but biases higher toward prior range midpoints as derivatives rebuild in a healthier configuration. Under this scenario, crash talk fades as structure repairs.
- Bear case (trend violation toward $26K): BTC fails to hold reclaimed levels, ETF outflows persist over several sessions, and attempts to recover get sold aggressively. Acceptance below the sweep’s low opens the door to lower demand clusters and, in an adverse macro tape, pushes probabilities toward Tate’s $26K target. The path is not linear; expect reflex bounces within a descending channel.
- Bull case (failed breakdown → expansion): The sweep marks a terminal flush, spot demand returns quickly, and BTC breaks above the prior range high on rising volume. Shorts scramble, and the market transitions from repair to expansion. While possible, this requires confirmation, not hope.
The lesson: price acceptance and flow confirmation will decide which branch we take. Predictions are hypotheses; risk management is the plan.
Risk Management: The Only Edge That Survives the Cycle
Bitcoin price prediction articles can be entertaining, but survival comes from rules. Define maximum position size, use hard stops or structured options, and never allocate based on a single influencer’s call—bullish or bearish. Headlines can nudge behavior, but your portfolio should answer to math, not personalities. Media coverage of the $26K forecast is a data point, not a decision engine.
Conclusion
The clash between Andrew Tate’s deep crash forecast and more constructive interpretations of the sell-off is crypto in a nutshell: loud, Bitcoin Price Prediction: conflicting, and often confusing. Bitcoin Price Prediction: The recent liquidity sweep fits a familiar market pattern where stops get raided, late momentum trades get punished, and price snaps back to test who actually understands structure. If BTC accepts back into value and flows stabilize, the crash narrative loses steam. Bitcoin Price Prediction: Bitcoin Price Prediction: Bitcoin Price Prediction: If the market fails, reclaims, and flows deteriorate, downside scenarios open. Either way, the smart money approach is the same—plan your invalidation, size appropriately, and let price prove the path.
FAQs
Q) What exactly is a “liquidity sweep,” and how does it affect Bitcoin price?
A liquidity sweep is a swift move beyond a well-watched level—such as a prior swing high or low—to trigger stop-losses and resting orders. Market makers and larger participants use these pools of liquidity to fill size. Bitcoin Price Prediction: After the sweep, price often reverts inside the prior range if the move was primarily to harvest liquidity rather than signal a trend change. Bitcoin Price Prediction: Recognizing sweeps helps traders avoid selling the low or buying a fake breakout.
Q) Did Andrew Tate really predict Bitcoin could fall to $26,000?
Yes. Multiple outlets reported Andrew Tate’s warning that BTC could drop to $26,000, Bitcoin Price Prediction: a level well below recent trading ranges. Bitcoin Price Prediction: The forecast arrived amid heightened volatility and liquidation flows, making it especially attention-grabbing. Bitcoin Price Prediction: Whether that target materializes depends on acceptance below key supports and sustained negative flows.
Q) Are there notable voices arguing the drop was a buyable dip instead?
Yes. Some market veterans framed the move as a buyable dip following heavy liquidations, Bitcoin Price Prediction: arguing it resembled a shakeout rather than the start of a collapse. These views highlight the importance of watching ETF flows, spot demand, and post-sweep reclaims for confirmation rather than anchoring to any one prediction.
Q) What signals would validate a deeper crash toward $26K?
Evidence would include failed reclaims of swept levels, Bitcoin Price Prediction: persistent ETF outflows over several sessions, declining spot participation, and clean acceptance below prior demand with expanding downside momentum. Bitcoin Price Prediction: If those conditions line up, lower targets transition from conjecture to probable path.
Q) How should I position around conflicting predictions?
Translate predictions into if-then plans. Bitcoin Price Prediction: If BTC holds reclaimed levels and flows stabilize, bias long with tight invalidation. If it rejects and flows worsen, reduce risk or position for further downside with defined stops. Above all, Bitcoin Price Prediction: size positions so no single thesis—bullish or bearish—can jeopardize your long-term capital.